
MIRISK Example Analysis
This is a walk-through example of the analysis MIRISK executes.
This is the opening screen.

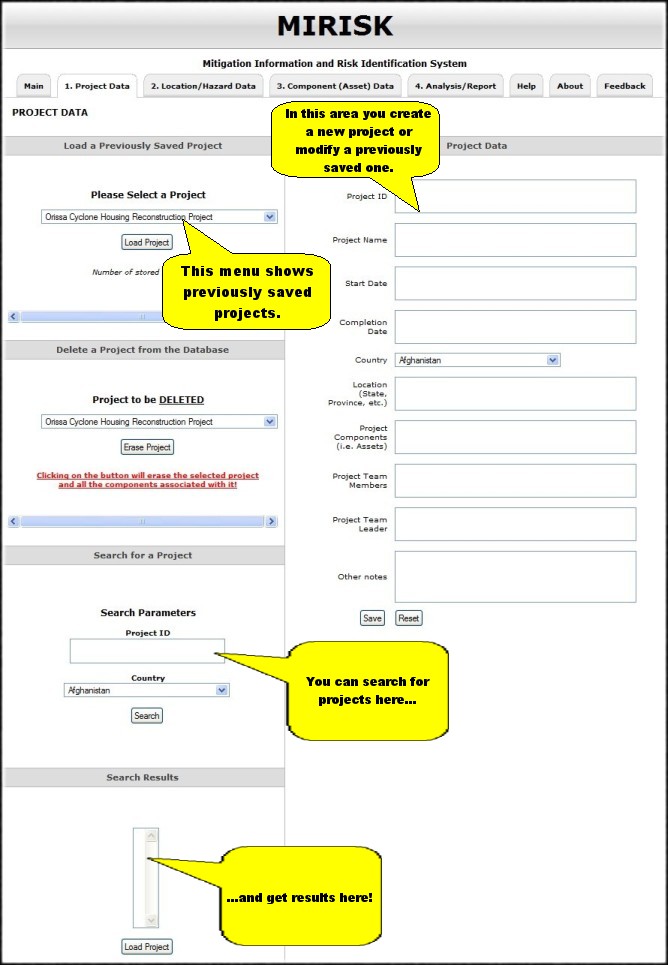
This is Tab 1: Project Data. You can enter project admin data here.
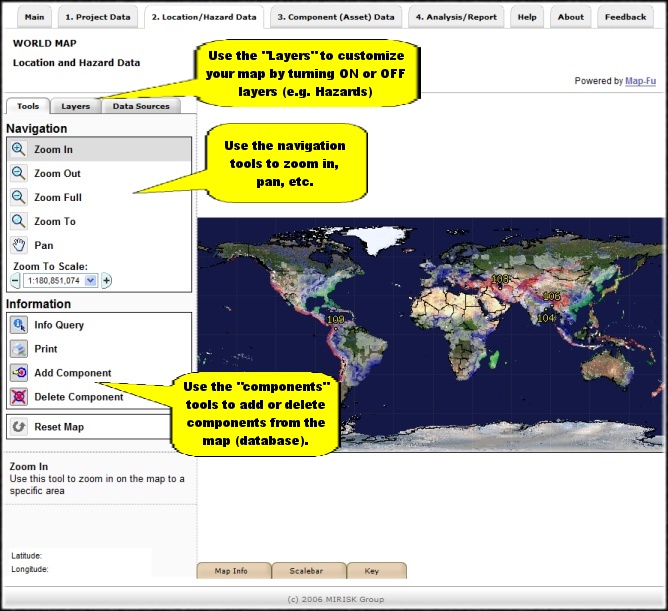
This is Tab 2: Location/Hazard Data.
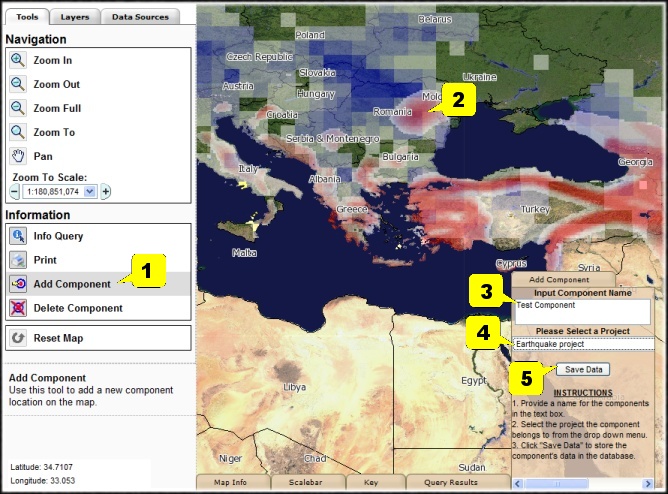
Adding a component:
- Click on the "Add Component" tool (LHS)
- Click on the desired location on the map
- Input the component's name
- Select the associated project from the drop-down menu
- Click "Save Data" (only once)
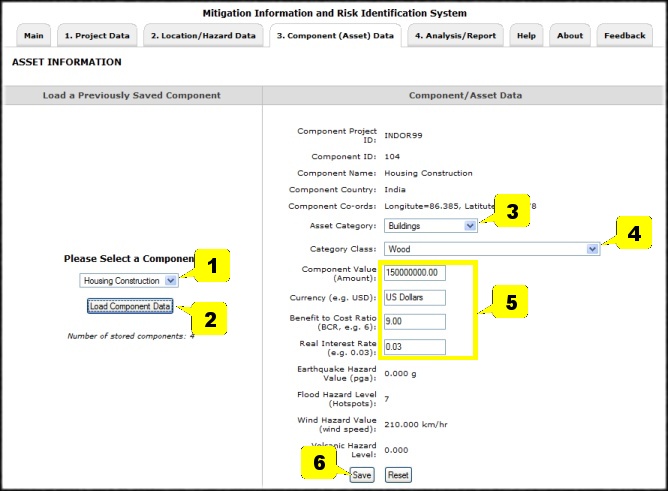
This is Tab 3: Component (Asset) Data. Here you can enter the component (asset) data needed for the cost benefits assessment calculations and also get information on various types of assets, their natural hazards vulnerabilities and mitigations.
Here is the procedure to follow:
- Select a component from the drop-down menu
- Click on "Load Component Data". The data will be loaded on the right pane.
- Select an asset category from the drop-down menu
- Select a category class from the drop-down menu. The bottom pane (see next picture) will load data specific to the selected category class
- Input "Component Value", "Currency", "Benefit to Cost Ratio" and "Real Interest Rate" in the text boxes.
- Click on "Save" (only once). A pop-up window will appear for you to verify the correctness of the inputted data.
The bottom pane of the "Component (Asset) Data".
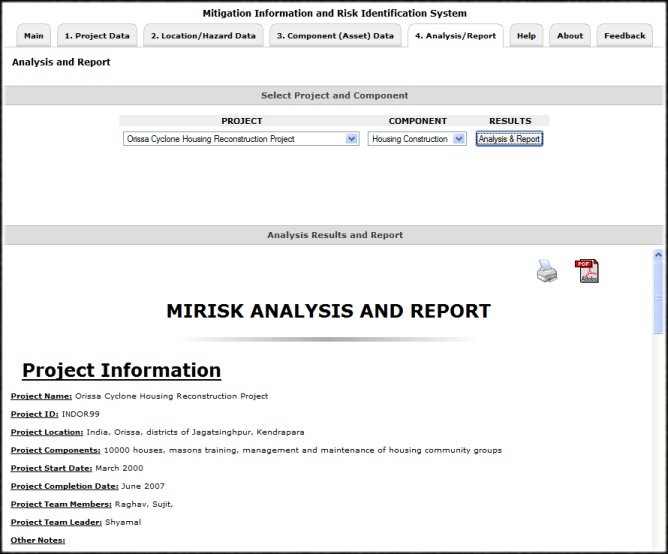
This is Tab 4: Analysis/Report. User (1) selects project and component; (2) clicks on "Analysis & Report", and then below Results appear, consisting of Project Input data etc, and estimated Expected Annualized Loss (EAL) for design level factor = 1 (minimum code), related data, and tabulated and graphed results of a benefit-cost analysis for various natural hazards affecting the component (asset) at the specified site. Optimum enhanced code levels are easily seen, as well as added construction cost and Total Cost Savings for the component. Icons permit printing or creating a pdf.
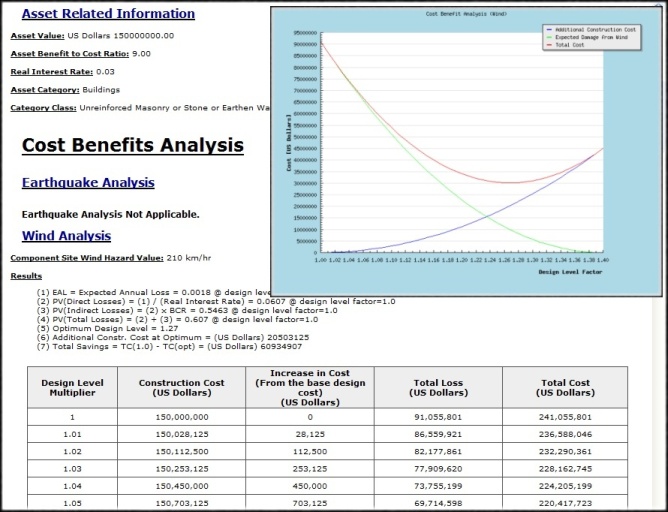
Analysis results in tabular and graphical form.
[ Back to MIRISK ]
最終更新日 2014年4月28日(月曜)18:53